
Hello BBBB Friends:
While we haven’t seen a repetition of the frenzy of new listings and sales we saw in January, this week we did have a small pickup in activity. I have two new listings to share with you today. However, there are many new contracts and final sales for homes that are Still on My List so be sure to keep scrolling down!
HEIGHTS REAL ESTATE MARKET UPDATE
HAR Chair Cathy Travino summed up the January market very nicely:
“January was a continuation of the slowdown that began last year with an onslaught of challenging economic conditions. I think what’s happening now reflects more of a return to seasonal home sales trending – slower volume during the holidays and new year – than a market in distress. Certainly consumers want assurances that inflation is subsiding, so if mortgage rates stabilize and homes continue hitting the market at more affordable price points, we could expect an upswing in sales later this year.”
HAR Press Release 1/8/23
Fun fact: Harris County is one of a handful of counties in the whole country where the sales price of single-family homes is increasing faster than rents. (ATTOM 2023 Rental Affordability Report)
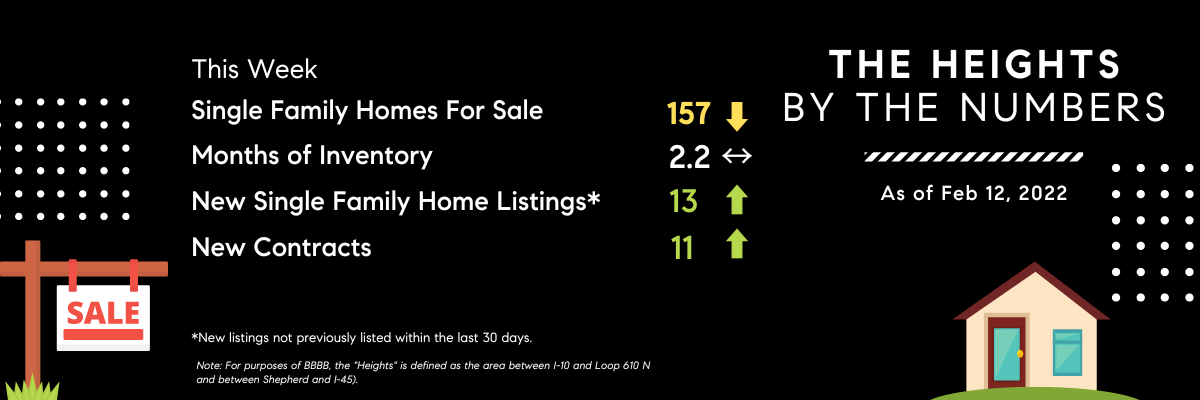
KEY FINDINGS FOR THE HEIGHTS FOR JANUARY 2023:
- The number of January sales dropped 37% year-over-year (January 2023 vs January 2022) and 39% compared to December 2022. January is typically the slowest sales month of the year, but this January was still 20% below that of pre-pandemic January 2020.
- In January, the average and median sales prices increased by 39% and 46%, respectively, year-over-year. However, compared to December 2022, average and median sales prices increased by only 7 and 12%, respectively. The ratio of million-dollar-plus homes also decreased from 22% to 16%. However, keep in mind that the low number of sales makes it difficult to evaluate monthly average and median sales swings.
- In a complete turnaround from most of 2022, a majority of the homes sold in January were on the market for more than 31 days. Only 29% went under contract within the first seven days of listing.
- The ‘Close to List Price Ratio’ for all December sales remained at 98% with a range of 87-106%. For those under contract within the first seven days, the ‘Close to List Price Ratio” was 100%, down from 101%.
- Indicative of the slowdown in real estate, for all sales, the median days on the market increased from 35 days in December to 58 days in January.
- Months of single-family home inventory* on hand hovered around 2.3 months for most of January; still a solid seller’s market. As a reminder, a balanced market is around five months of inventory, so we still have a long way to go!
- December’s highest over-list price sale award goes to a Norhill fixer-upper bungalow. It sold for 3% ($11,000) over the list price.
*Months of Inventory is a measure of how fast all the existing homes on the market would last, assuming a) no more listings are added and b) the rate at which homes sell is a constant figure based on the average of the last 12 months of sales.
HEIGHTS* KEY MARKET INDICATORS -SINGLE-FAMILY HOMES
| SINGLE-FAMILY HOMES | JAN 2023 | JAN 2022 | CHANGE | DEC 2022 | CHANGE |
| ACTIVE LISTINGS | 177 | 135 | 31.1% | 179 | -1% |
| SALES | 31 | 49 | -37% | 51 | -39% |
| AVG SALES PRICE | $852,100 | $613,731 | 39% | $795,389 | 7.1% |
| MEDIAN SALES PRICE | $779,100 | $533,333 | 46% | $698,000 | 12% |
| AVG DAYS ON MARKET | 72 | 99 | -27% | 54 | 33% |
| MEDIAN DAYS ON MARKET | 58 | 53 | 9% | 35 | 65% |
| CLOSE PRICE-TO-LIST PRICE RATIO | 98% | 99% | -1% | 98% | 0% |
Note: Median represents the “middle” number and better represents central tendency than average. For example, the median sales price is the figure at which half of the homes sold for more and half sold for less.
SOLD TO LIST PRICE RATIO ANALYSIS-JAN 2023
| DAYS ON MARKET | ALL | 0-7 | 8-30 | 30+ |
| HOMES SOLD | 31 | 9 | 6 | 16 |
| MEDIAN SALES PRICE/LIST PRICE RATIO (SP/LP) | 98% | 100% | 97% | 97% |
| SP/LP RANGE | 87-106% | 93-106% | 87-101% | 88-100% |
Source: HAR
Let’s look at houses or talk about selling yours!
Becky Davis
—
Information About Brokerage Services
TREC Consumer Protection Notice
Becky Davis
Compass Realty
832-628-8221
Thinking of selling? We can front the cost for painting, landscaping, upgrades, and more. No fees or interest, EVER! Click here for more information.
*Note: For purposes of BBBB, the “Heights” is defined as the area between I-10 and Loop 610 N and between Shepherd and I-45).
The Week’s Featured Properties
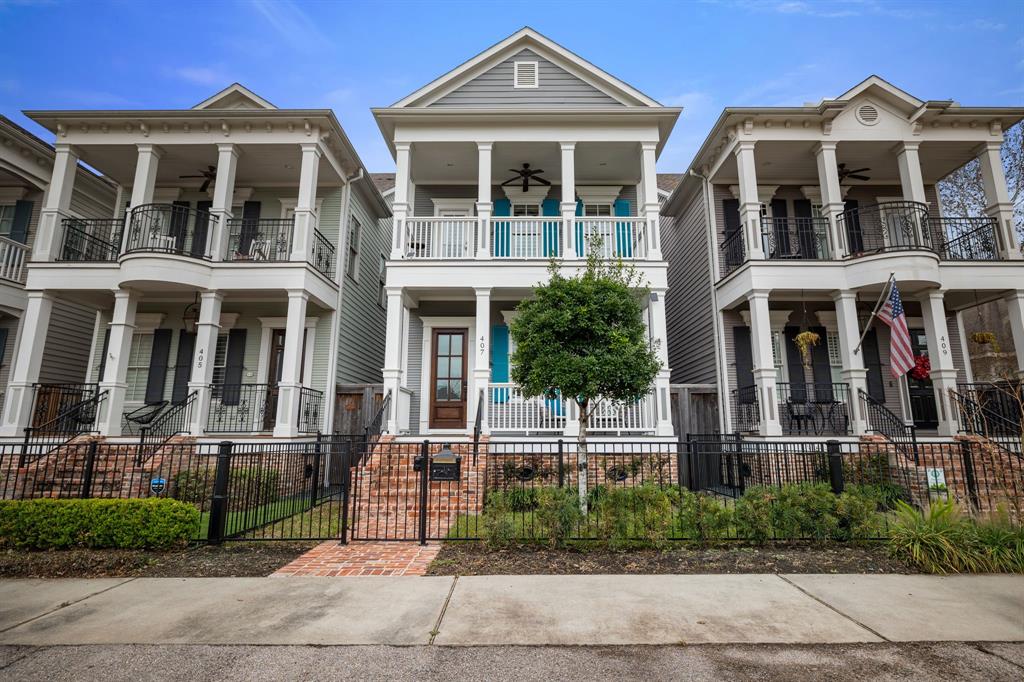
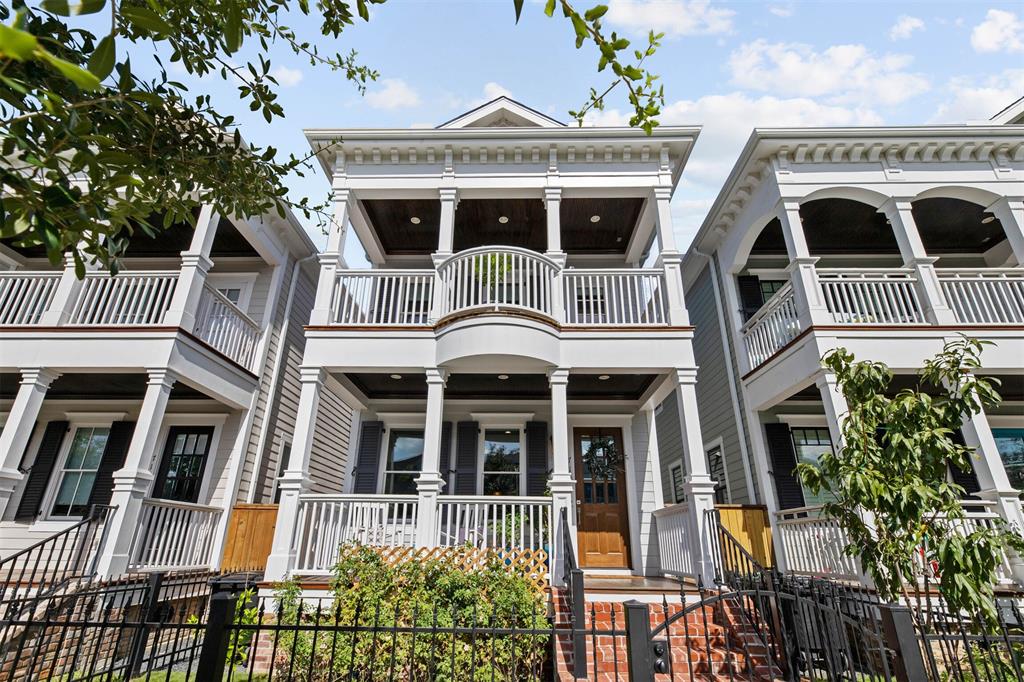
407 Columbia: $929,900
- Houston Heights
- Greek Revival built 2014 by Concord Builders
- 3/3/1, 3568 sq ft on a 3300 sq ft lot
- Double gallery front porches
- Study/home office
- All bedrooms up with ensuite baths
- 3rd-floor game room
- Bricked patio between house & garage (greenspace is the front yard)
- Alley access to 2-car detached garage
- Additional parking in front
- Zoned to Harvard Elementary
Super convenient location. Easy access to I-10 plus walk to restaurants on White Oak.
******
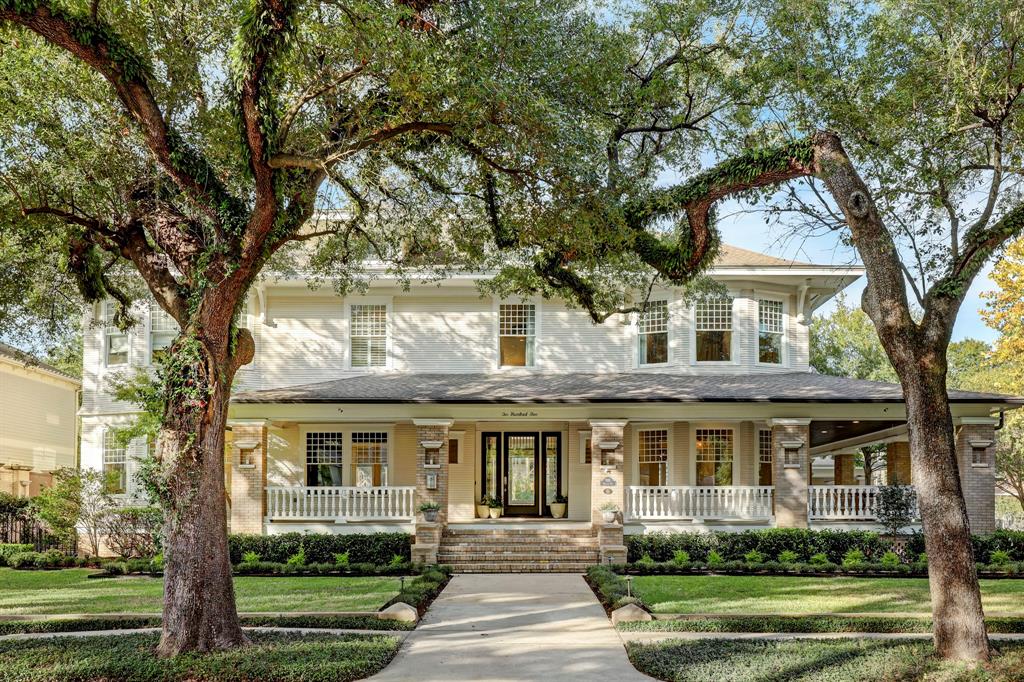
514 Woodland: $2,050,000
- Woodland Heights Historic District
- American Four Square, c. 1932
- 4/3/1, 4198 sq ft on a 6200 sq ft lot
- Renovated/expanded 2022 by Tribe Build Co
- White oak hardwoods with herringbone patterns in several areas
- Study/home office
- High-end finishes throughout
- Large primary suite with tray ceiling, huge primary closet
- Gameroom
- Small backyard
- Driveway access to 2-car attached garage
- Zoned to Travis Elementary
Within walking distance of Travis Elementary and a short distance to Woodland Park, Stude Park, and the hike and bike trail.
******
This Week’s Price Reductions & Status Updates
OPTION PENDING
206 E 24th St: $595,000
- Milroy Place
- Brick Colonial c. 1930
- 2/2, 1140 sq ft on a 5300 sq ft lot
- Original List Price: $595,000
- Days on Market: 7
******
OPTION PENDING
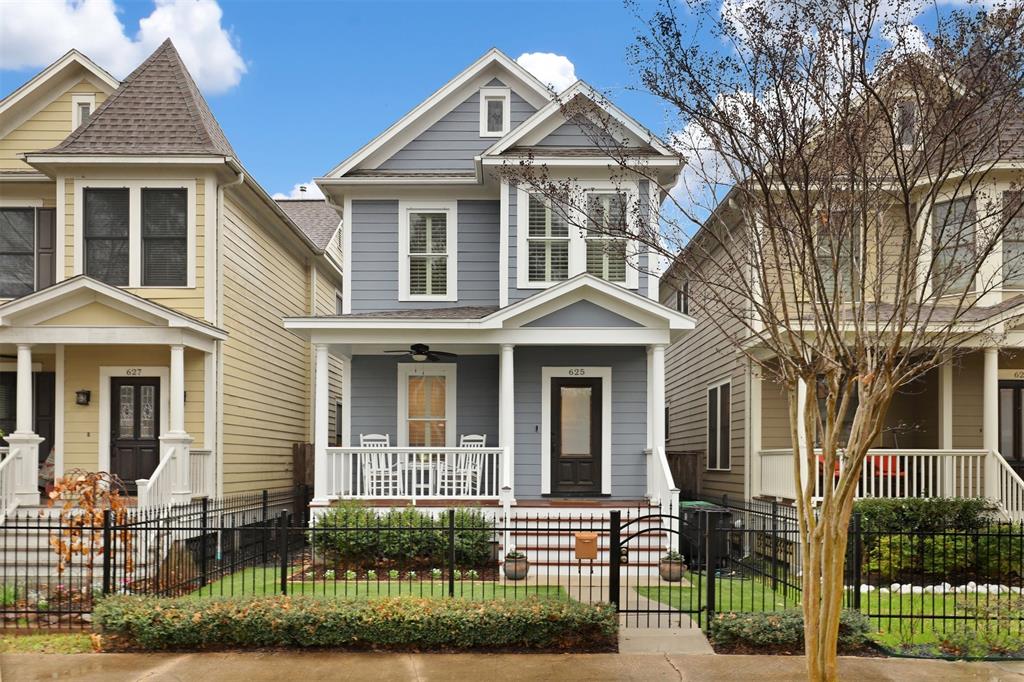
625 W 21st: $695,000
- Houston Heights
- Craftsman, c. 2011 by Ostlind Thomas
- 3/2/1, 2119 sq ft on a 3275 sq ft lot
- Original List Price: $695,000
- Days on Market: 10
******
PENDING
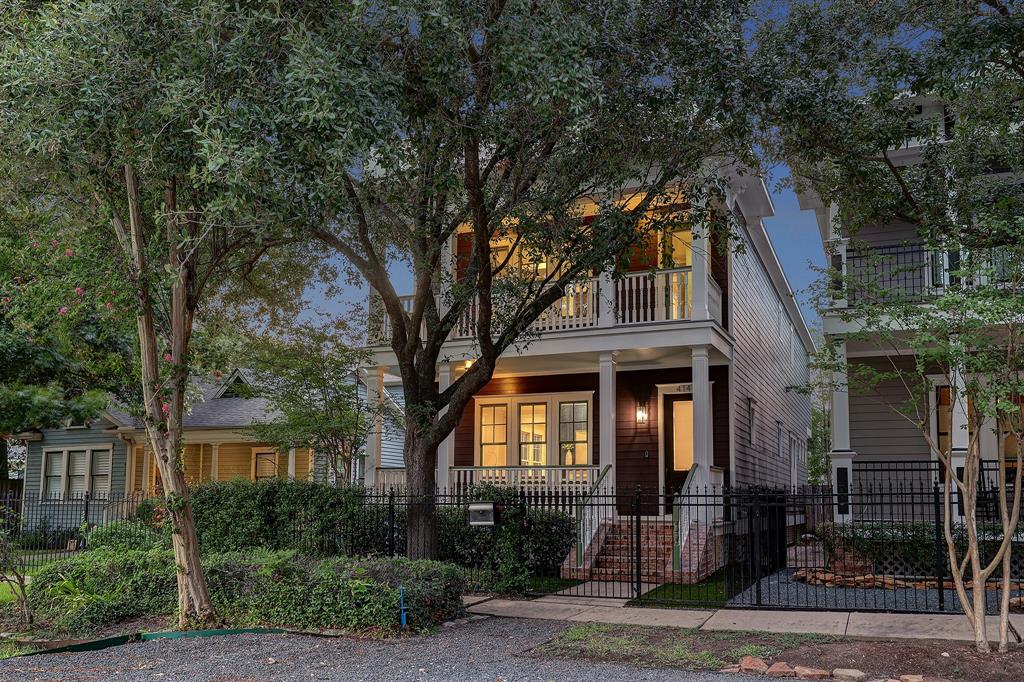
414 Cortlandt: $899,000
- Heights South Historic District
- Greek Revival c. 2004 by Ascent Homes
- 3/2/1, 2760 sq ft on 3960 sq ft lot
- Original List Price: $985,000
- Days on Market: 154
******
OPTION PENDING
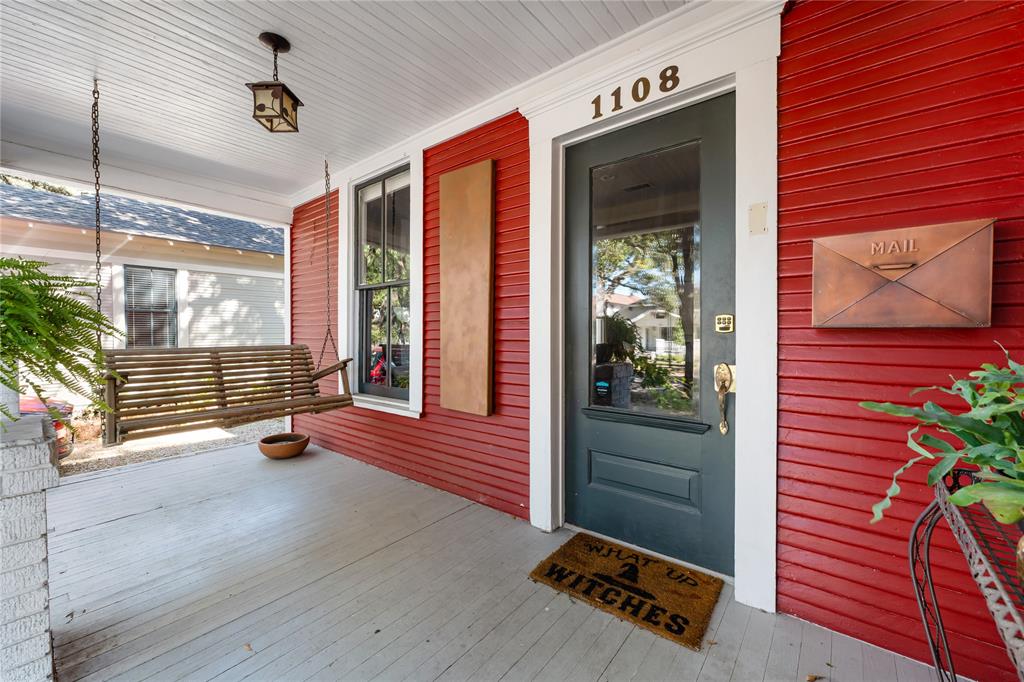
1108 Arlington: $950,000
- Heights East Historic District
- Bungalow, c. 1920
- 3/2/1, 2316 sq ft on 6600 sq ft lot
- Original List Price: $975,000
- Days on Market: 90
******
OPTION PENDING
444 W 22nd St: $1,050,000
- Houston Heights
- Greek Revival, c. 2016 by Ansari Homes
- 3/2/1, 2793 sq ft on a 3500 sq ft lot
- Original List Price: $1,050,000
- Days on Market: 3
******
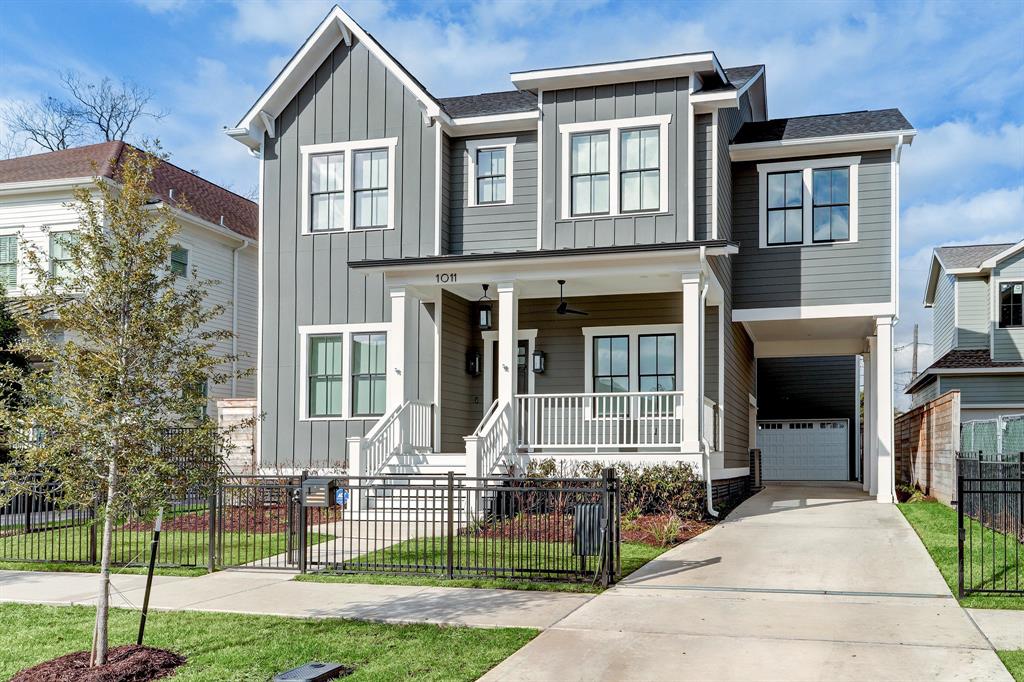
OPTION PENDING
1011 E 7th St: $1,950,000
- Norhill (south of 11th/not the historic district)
- Modern farmhouse, c. 2021 by Modern Bungalow
- 5/5, 4441 sq ft on a 6600 sq ft lot
- Original List Price: $1,999,999
- Days on Market: 26
******
Going, Going, Gone!
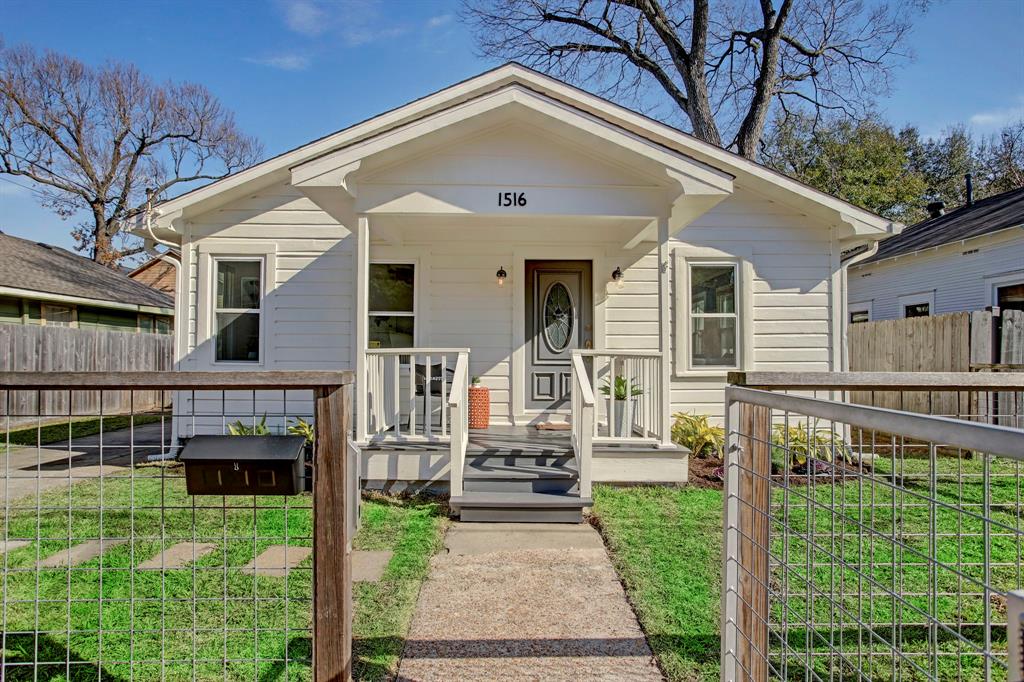
1516 Lawrence: $570,000
- Houston Heights
- Craftsman bungalow circa 1930
- 2/1/1, 1258 sq ft on a 5000 sq ft lot
- Price at Time of Contract: $539,000
- List to Sell Ratio: 106%
- Original List Price: $539,000
- Days on Market: 4
- Title Paid By: Seller
- Seller Contribution to Buyer Closing Costs: $1,500
******
710 Ashland: $925,000
- Ashland Trails
- Greek Revival, c. 2017 by Sullivan Brothers
- 3/2/1, 2304 sq ft on a 3255 sq ft lot
- Price at Time of Contract: $950,000
- List to Sell Ratio: 97%
- Original List Price: $950,000
- Days on Market: 5
- Title Paid By: Seller
- Seller Contribution to Buyer Closing Costs: $800
******
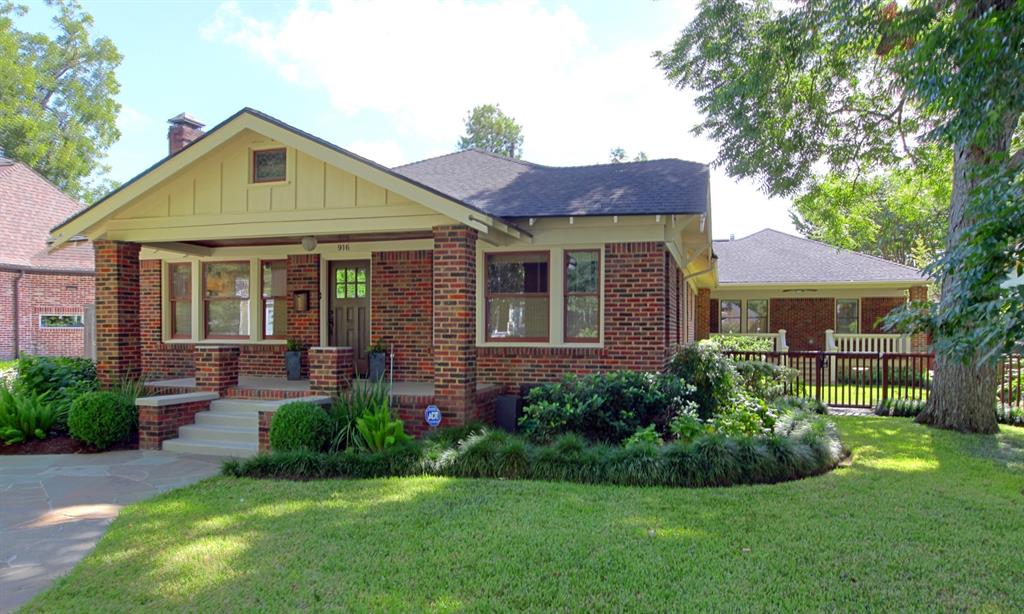
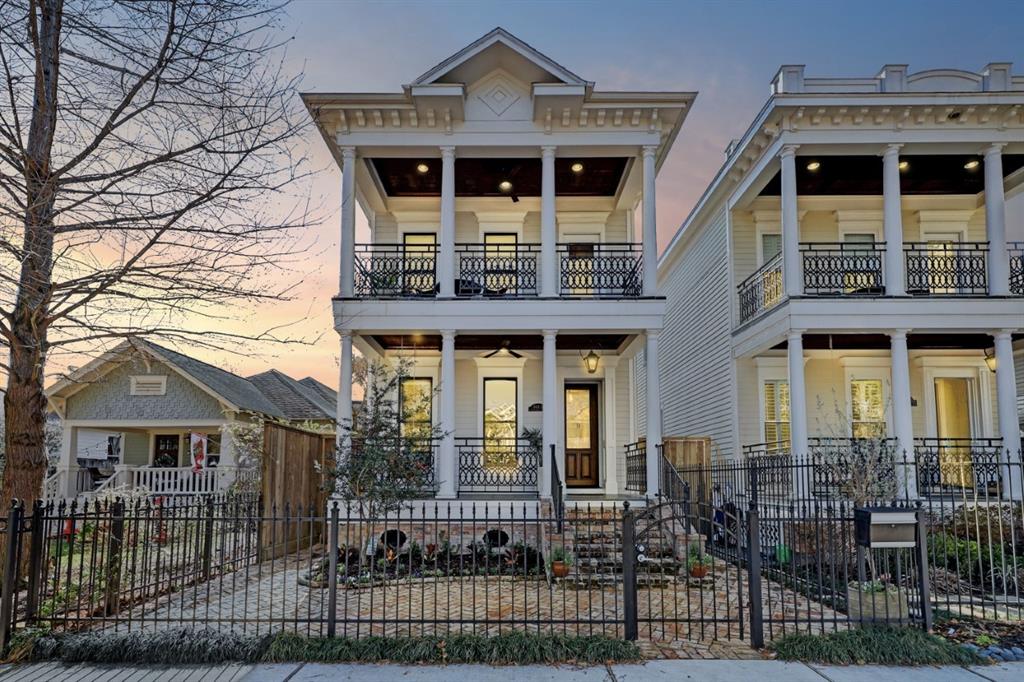
916 Arlington: $1,175,000
- Heights South Historic District
- Brick Craftsman Bungalow c. 1920
- 3/2, 2598 sq ft on 9900 sq ft lot
- Price at Time of Contract: $1,225,000
- List to Sell Ratio: 96%
- Original List Price: $1,350,000
- Days on Market: 127
- Title Paid By: Seller
- Seller Contribution to Buyer Closing Costs: $8,000
******
205 Bayland: $3,131,775
- Woodland Heights Historic District
- Prairie style, c. 1910
- 3/4/2, 6317 sq ft on a 20,657 sq ft lot
- Price at Time of Contract: $3,495,000
- List to Sell Ratio: 90%
- Original List Price: $3,495,000
- Days on Market: 26
- Title Paid By: Seller
******
But wait, there’s more…
This is just the latest and greatest; however, there are still lots more on my list that you can check out here:
Social Cookies
Social Cookies are used to enable you to share pages and content you find interesting throughout the website through third-party social networking or other websites (including, potentially for advertising purposes related to social networking).