
KEY FINDINGS
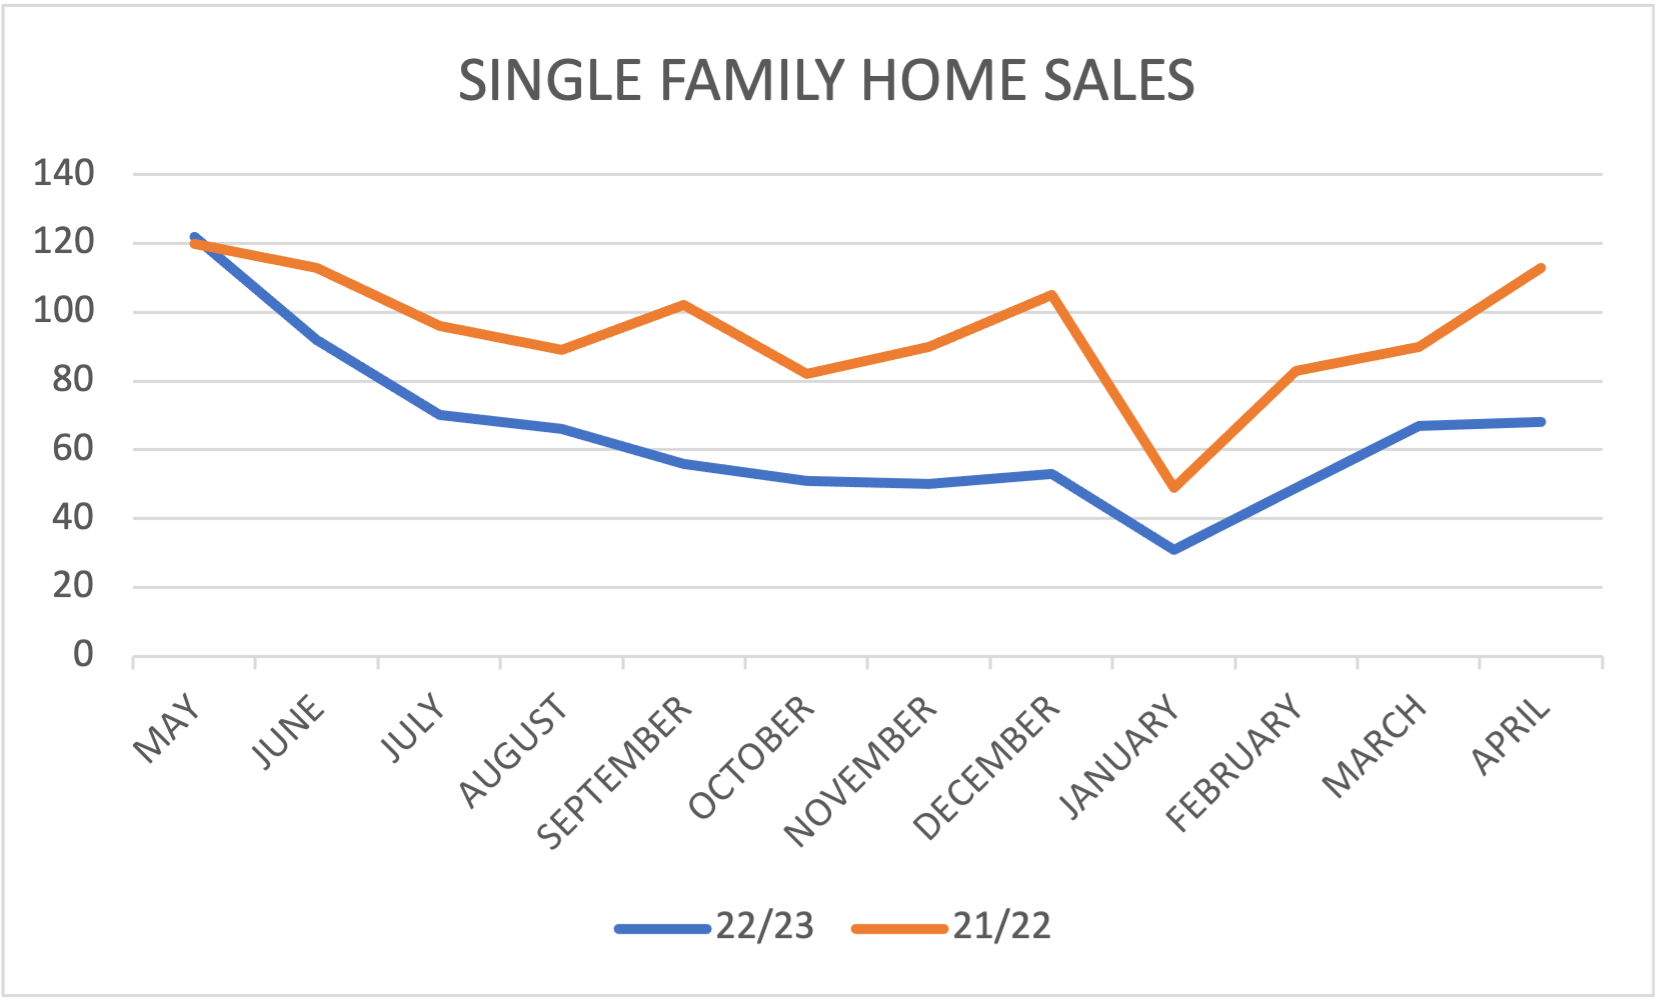
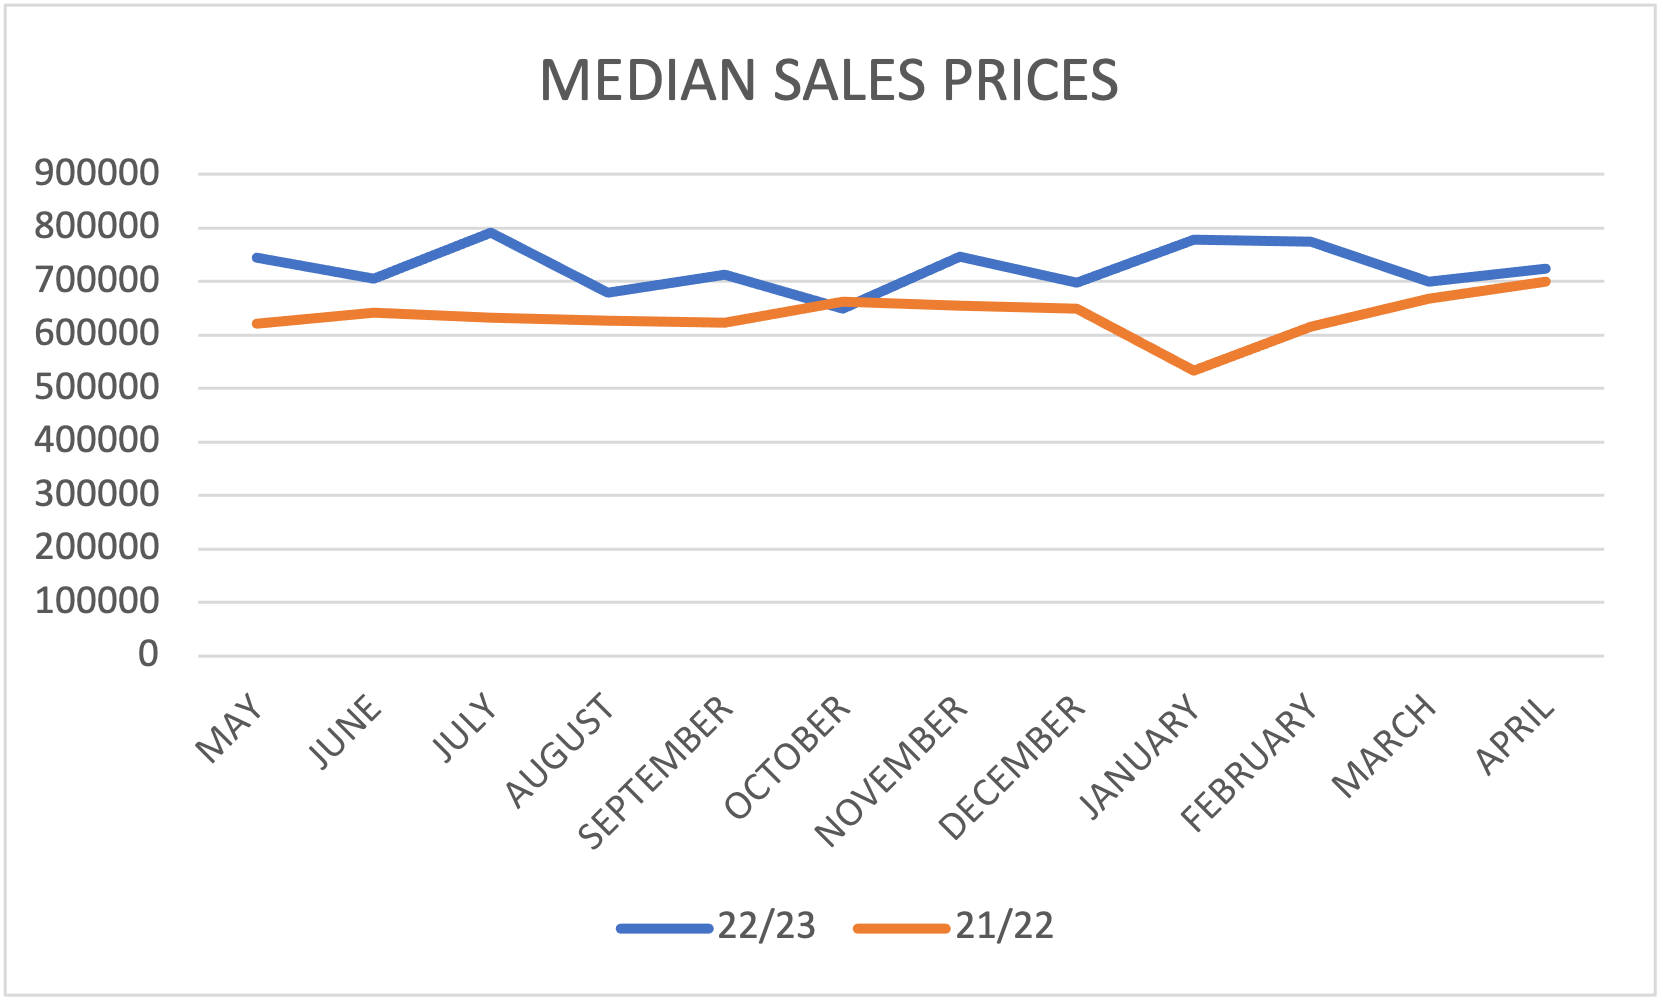
The journey towards market “normalcy” has been quite the rollercoaster ride, with mortgage rates playing a wild game of ups and downs. Despite the 12th consecutive month of lower sales volume than the previous year, median home prices in the Heights have proved to be quite sturdy, only slightly lagging behind the levels seen in 2022 for just one out of the past 12 months. Hang tight as we navigate these market fluctuations because the Heights is holding its ground!
Additional findings:
- The “Close to List Price Ratio” for all sales in April was 99%, with a range of 75% to 112%. This means that, on average, homes sold for 99% of their listed price. The “Close to List Price Ratio” remained at 100% for homes under contract within the first seven days of listing.
- In April, the median number of days on the market for homes in the area dropped from 22 to just nine days. This is on par with the activity seen in April of 2022, indicating a strong level of buyer interest and faster home sales. Sellers can take this as good news, as it suggests a competitive market with the potential for quick offers.
- Inventory for single-family homes has increased slightly from 2.6 to 2.8 months, but it remains a seller’s market. This means there are more buyers than available homes, giving sellers an advantage. Buyers should expect competition as they search for a home.
- April’s highest over-list price sale award goes to a renovated bungalow in the Heights West Historic District. It sold for 112% ($125,000) over the list price.
*Months of Inventory is a measure of how fast all the existing homes on the market would last, assuming a) no more listings are added and b) the rate at which homes sell is a constant figure based on the average of the last 12 months of sales.
HEIGHTS* KEY MARKET INDICATORS -SINGLE-FAMILY HOMES
| SINGLE-FAMILY HOMES | APR 2022 | APR 2023 | CHANGE | MAR 2023 | CHANGE |
| ACTIVE LISTINGS | 136 | 180 | 32.4% | 186 | -3.2% |
| SALES | 113 | 68 | -39.8% | 67 | 1.5% |
| AVG SALES PRICE | $804,863 | $755,708 | -6.1% | $809,951 | -6.7% |
| MEDIAN SALES PRICE | $700,000 | $723,530 | 3.4% | $699,900 | 3.4% |
| AVG DAYS ON MARKET | 38 | 67 | 76.3% | 60 | 11.7% |
| MEDIAN DAYS ON MARKET | 8 | 9 | 12.5% | 22 | -59.1% |
| CLOSE PRICE-TO-LIST PRICE RATIO | 100% | 99.8% | -0.2% | 99.3% | 0.5% |
Note: Median represents the “middle” number and better represents central tendency than average. For example, the median sales price is the figure at which half of the homes sold for more and half sold for less.
SOLD TO LIST PRICE RATIO ANALYSIS-APR 2023
| DAYS ON MARKET | ALL | 0-7 | 8-30 | 30+ |
| HOMES SOLD | 68 | 32 | 23 | 13 |
| MEDIAN SALES PRICE/LIST PRICE RATIO (SP/LP) | 99.8% | 100.2% | 98.3% | 96.8% |
| SP/LP RANGE | 75.1-111.6% | 96.2-111.6% | 75.1-102.2% | 84.8-100% |
Source: HAR
Social Cookies
Social Cookies are used to enable you to share pages and content you find interesting throughout the website through third-party social networking or other websites (including, potentially for advertising purposes related to social networking).